How to calculate a personal injury settlement
Every settlement negotiation runs on the same basic math. Add up your economic damages. Add your non-economic damages. Then adjust the total for fault, insurance limits, and the strength of your evidence. The formula is easy to state and hard to apply, because nearly every number that goes into it gets contested.
This guide breaks down each input, what California law says about each one, and what happens to the total before it reaches your bank account. If you want to run your own numbers as you read, our injury settlement calculator uses this same framework.
Key Takeaways
- A personal injury settlement equals economic damages plus non-economic damages, adjusted for fault and insurance policy limits.
- Neither economic nor non-economic damages are capped in ordinary California injury cases. The one exception is medical malpractice.
- California’s pure comparative negligence rule reduces your recovery by your share of fault but never eliminates it.
- The multiplier method is a negotiating convention, not law. No statute or jury instruction requires it.
- Your gross settlement and your take-home amount are two different numbers. Attorney fees and medical liens come out first.
What is the formula for a personal injury settlement?
Economic damages plus non-economic damages equals the baseline value of a claim. From there, three adjustments apply: your percentage of fault, the at-fault party’s insurance policy limits, and how well your evidence documents everything you claim.
That is the whole formula. There is no secret equation that produces the “real” number. You may have read about the multiplier method, where medical bills get multiplied by 1.5 to 5 depending on severity. It exists, but as a rule of thumb, attorneys and adjusters use it to estimate the non-economic piece during negotiation. No California statute requires it. No jury instruction mentions it. A jury deciding your case is told to use its judgment, not a multiplication table.
How the math works
From damages to a claim value
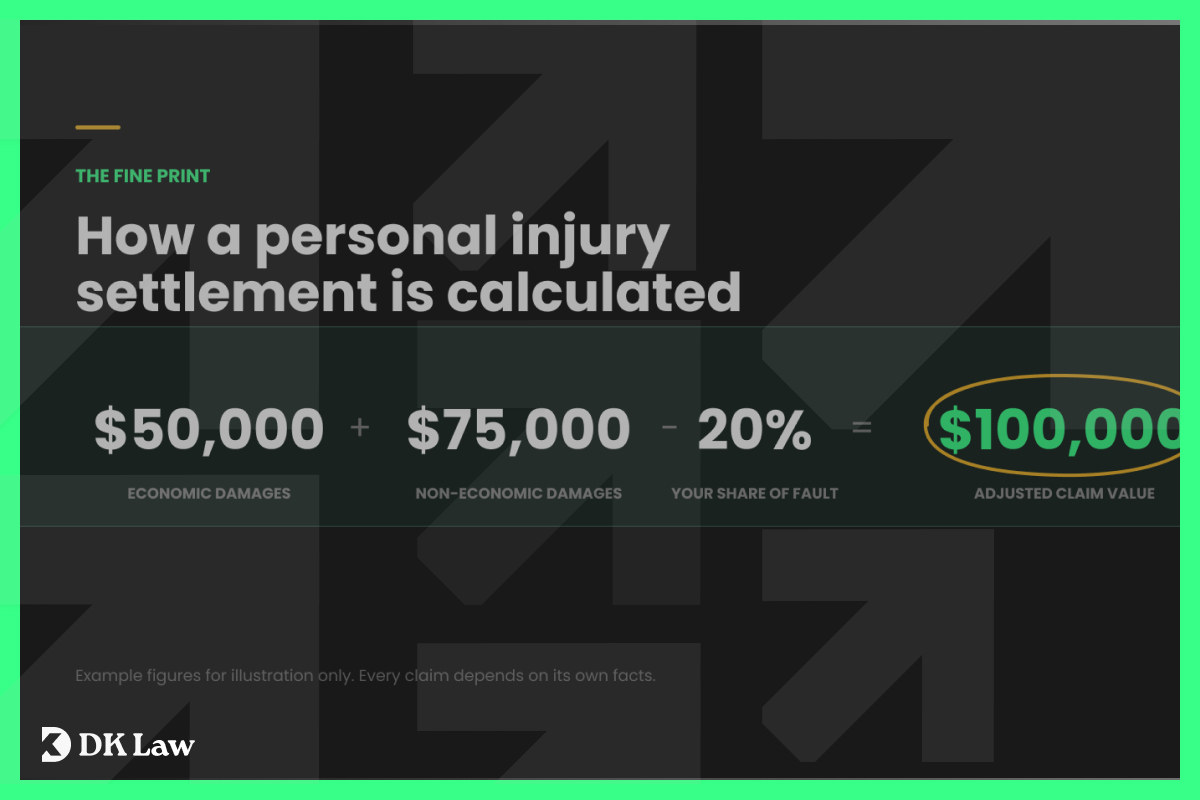
Follow one example claim through the same framework our settlement calculator uses. The numbers below are examples only. Every case is different.
Step 1
Economic damages
$50,000
- Medical bills, at the amount paid
- Lost wages and future earning capacity
- Future care, mileage, household help
Objectively verifiable losses. Receipts, records, pay stubs.
Step 2
Non-economic damages
$75,000
- Pain and physical suffering
- Anxiety, grief, emotional distress
- Lost enjoyment of life
Often estimated at 1.5x to 5x of economic damages. A negotiating convention, not a legal formula.
Step 3
Your share of fault
−$25,000
- Baseline claim: $125,000
- Fault assigned to you: 20%
California’s pure comparative negligence rule reduces recovery by your share of fault. It never eliminates it.
Adjusted claim value
What this example claim is worth
$100,000
- Before attorney fees and medical liens
- Gross and net are different numbers
Subject to the at-fault party’s insurance policy limits.
Example figures for illustration only. No result is guaranteed. Every claim depends on its own facts.
Economic damages: everything that counts
Economic damages are your objectively verifiable monetary losses. That is the actual statutory language from Civil Code section 1431.2, which lists medical expenses, lost earnings, property loss, and the cost of substitute domestic services, among others. Older case law and court filings often call these special damages, the same category under a different name.
California’s civil jury instructions break the category into specific line items, and the list rewards a close read, because claimants routinely leave several of these off their own tally.
| Category | What it covers | How you prove it |
|---|---|---|
| Past medical expenses | ER visits, surgery, imaging, physical therapy, prescriptions | Bills and payment records |
| Future medical costs | Projected surgeries, ongoing care, equipment replacement | Medical opinions, life care plans |
| Lost earnings | Pay you missed while recovering | Pay stubs, employer letters, tax returns |
| Lost earning capacity | Reduced ability to earn going forward | Vocational and medical experts |
| Household services | Cleaning, childcare, yard work you now pay for or can no longer do | Receipts, testimony |
| Medical travel | Mileage and parking for treatment visits | Mileage log, receipts |
| Property damage | Vehicle repair or replacement, damaged personal items | Repair estimates, receipts |
| Out-of-pocket costs | Copays, medical equipment, home modifications | Receipts |
Lost earnings and lost earning capacity sound like the same thing. They are not. Lost earnings cover the paychecks you already missed. Lost earning capacity covers your reduced ability to earn money in the future, and California’s jury instructions say a claimant does not even need a work history to claim it. A 24-year-old apprentice electrician who can no longer climb ladders has a small lost earnings claim and potentially an enormous earning capacity claim. Conflating the two undervalues serious injuries more than almost any other mistake.
Future medical costs deserve the same rigor as past ones, and they rarely get it from unrepresented claimants. A herniated disc that needs a fusion in eight years, a knee replacement that wears out on a schedule, injections every six months for the foreseeable future. These are provable damages, but they require medical opinions and sometimes a life care plan to price. Settle before those projections exist and the money for that future surgery comes out of your own pocket, because a signed release closes the claim for good.
Medical travel is the line item nearly everyone forgets. Every drive to physical therapy is compensable. No California statute sets a per-mile rate, so claims typically reference the IRS medical mileage rate, which rose to 23.5 cents per mile in July 2026. The IRS number is a tax deduction figure rather than a court-mandated rate, but it gives adjusters a benchmark they recognize. Forty round trips to a clinic 15 miles away is real money, and documenting it costs you nothing beyond keeping a log.
How do medical bills actually get counted?
Not at the sticker price. The California Supreme Court held in Howell v. Hamilton Meats that a plaintiff whose treatment was covered by insurance recovers the amount the insurer actually paid, rather than the higher amount the hospital originally billed.
A $90,000 hospital invoice that your health plan settled for $22,000 counts as $22,000 in past medical damages. This one rule explains why two people with identical injuries can have very different claim values. It also means any calculator asking for “total medical bills” needs the paid figure, and using the billed figure will inflate the estimate.
Non-economic damages: putting a number on pain
California defines non-economic damages as subjective, non-monetary losses. Pain, suffering, mental suffering, emotional distress, inconvenience, loss of enjoyment of life. The California Supreme Court treats all of it as one unitary concept.
In Capelouto v. Kaiser Foundation Hospitals, the court listed fright, nervousness, grief, anxiety, worry, shock, and humiliation as compensable forms of suffering under the same umbrella. California law treats the anxiety you carry after a crash as a compensable part of the claim itself. We cover how psychological injuries get valued in our guide to pain and suffering versus anxiety.
So how does anyone put a dollar figure on grief or worry? Through negotiation and judgment. The multiplier method estimates the figure by multiplying economic damages. The per diem method assigns a daily dollar rate to your suffering and multiplies by the days of your recovery. Both are conventions. Both produce starting points, not answers, and a skilled negotiator treats them that way.
California places no cap on non-economic damages in ordinary injury cases. The exception is medical malpractice, where MICRA caps non-economic recovery at $470,000 for injury cases and $650,000 for wrongful death in 2026, figures that step up each January.
What changes the number in California
Three California rules move settlement values more than anything else.
Pure comparative negligence. Since Li v. Yellow Cab Co. in 1975, California reduces your recovery by your percentage of fault without ever cutting it off. At 30% fault on $100,000 in damages, you can still recover $70,000. Some states bar recovery past 50% fault. California does not. If fault is contested in your case, our article on being partially at fault walks through how those percentages get assigned.
Policy limits. Damages on paper mean little beyond what insurance can pay. California’s minimum liability limits rose to $30,000 per person and $60,000 per accident in January 2025 under SB 1107, with $15,000 for property damage. Better than the old minimums. Still far below the cost of one surgery. When damages exceed limits, the search turns to other sources: your own underinsured motorist coverage, additional defendants, umbrella policies.
Prop 213. Under Civil Code 3333.4, an uninsured driver injured in a crash cannot recover non-economic damages, even when the other driver caused everything. Economic damages remain available. One exception matters: if the at-fault driver was convicted of DUI in connection with the crash, the bar lifts and full non-economic recovery is back on the table.
A fourth factor runs underneath all three: documentation. The same injury with a gap in treatment, a thin medical file, or no wage records settles for less than it should, because every undocumented dollar becomes a dollar the adjuster can dispute. The formula only works with inputs you can prove.
How much of your settlement do you actually keep?
The number that matters is the net, and it is smaller than the gross. Three deductions come first.
Attorney fees. Contingency fees in personal injury cases commonly run one-third to 40 percent of the recovery, with the higher end applying when a case goes into litigation.
Case costs come out too: filing fees, medical records, expert witnesses.
Medical liens. If your health plan, a hospital, or Medi-Cal paid for accident treatment, they hold a reimbursement claim against your settlement. California caps a health insurer’s lien at one-third of your settlement when you have an attorney, half when you do not, and the common fund doctrine reduces liens further to account for the legal work that produced the recovery. Medi-Cal liens follow their own rules, including a statutory 25 percent reduction for attorney fees plus a share of litigation costs. Liens get paid from the trust account before your check is written. Our lien negotiation guide covers how much these claims can shrink.
Say a case settles for $100,000. A one-third fee takes $33,000, case costs take $3,000, and a health plan lien negotiated down to $18,000 comes out next. The client’s net: $46,000. Different facts produce very different splits, which is why lien negotiation is where a lot of a settlement’s real value gets won or lost.
Run your own numbers
The framework above is what our injury settlement calculator walks through: your economic inputs, an estimated non-economic range, and California’s fault adjustments. The output is an estimate. Every case turns on its own facts, and the ranges in a serious injury case usually justify a professional valuation.
If you were injured in California and want to know what your claim may be worth, contact DK Law today for a free consultation.
DK All the way


From Your Case to Compensation, we take your case all the way.
Schedule a Free Consultation
Get Expert Legal Advice at Zero Cost.
At DK Law we’re with you – all the way.
Get a Free Consultation with our experts today!